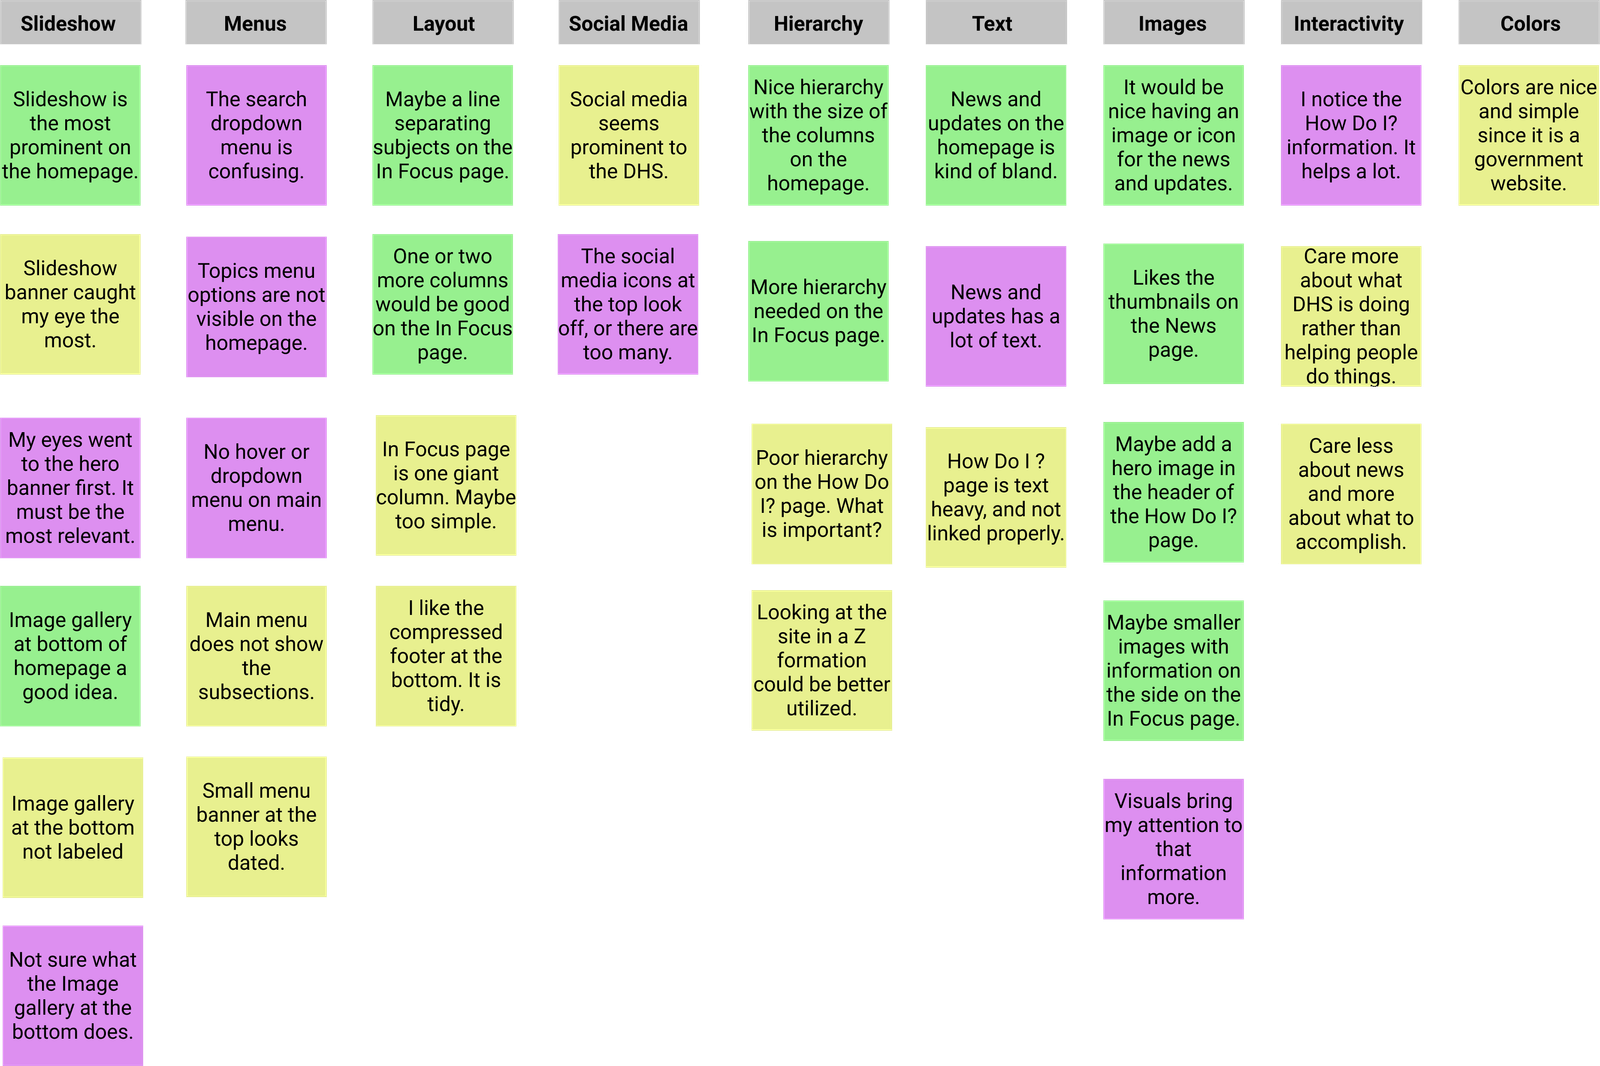
Affinity Diagram (Sorted)
The sticky notes were then organized into natural relationships. This led to the processing, sorting, and identification of key insights regarding the data. In all, there were 9 separate categories to order the ideas taken from the interviews.
×